Environmental Integrity Project launches updated Oil & Gas Watch database and news site
The Oil & Gas Watch database and news site are being re-launched today (Aug. 1) with new features to make it easier for users to track oil and gas developments in local areas and gather national data on the growing industry.
The Environmental Integrity Project (EIP) redesigned the Oil & Gas Watch database to feature a new “alerts” function to highlight new projects, updates, and public hearings. The database also now has improved search tools; the projected greenhouse gas and related health impacts of projects; new maps; and sharable summary pages for industries such as liquefied natural gas, plastics, and petrochemicals, among other sectors. We also redesigned our weekly newsletter.
EIP will host a free virtual webinar at 1 p.m. Eastern time on Aug. 21 to explain how to use the new database. Sign up by using this link. RSVPs are required.
EIP first launched the Oil & Gas Watch database in April 2022 to track the effects of the U.S. oil and gas boom fueled by the expanded use of fracking and new drilling techniques. This boom has led to the rapid construction of a wave of processing plants and refineries that convert fracked oil and gas into plastics, fuels, petrochemicals, chemical fertilizer, and electricity. This boom has also driven an exponential increase in the pipeline networks and storage hubs needed to transport oil and gas from production wells to export terminals and other sites.
Since then, the database has been updated weekly using regulatory filings, public records from state environmental agencies, corporate filings, company news releases, and media articles. The database features details and public records on 608 projects built since 2012, along with 650 planned projects. More information and public records are added every week.
With the redesign, users are now able to more easily understand how much pollution will likely be produced by a new facility or expansion project. If all 650 planned projects tracked in the database were built, they would have the potential to emit a combined 186 million tons of greenhouse gas emissions per year, equivalent to nearly 48 coal-fired power plants or the energy use of 24.2 million homes.
Where information is available, the database also makes it easier to learn when local hearings are planned and when to submit public comments to regulators for certain permits. Users can closely follow new developments at tracked facilities with new “alerts” on Oil & Gas Watch, which are updated weekly.

The database is meant as a free public resource for community members, advocates, journalists, policymakers, regulators, and people in the oil and gas industry. Data from the project has been cited as the basis for articles in The Washington Post, the Guardian, Inside Climate News, Grist, Houston Public Media, the Midland (Texas) Reporter-Telegram, Vox, and other news outlets.
While industry and its supporters frequently trumpet the dollar value of new oil and gas projects and the number of jobs they create, news releases rarely include figures on these facilities’ air and water pollution and greenhouse gases. That’s where the Oil & Gas Watch database comes in. Each facility in the database has its own landing page, complete with a map, potential air pollution and greenhouse gases, demographic data on surrounding communities, and information about other linked projects and permits.
For example, the Oil & Gas Watch database features details on terminals that export liquified natural gas (LNG). The U.S. has seen a massive rise in gas exports over the past decade, fueled by hydraulic fracturing and the war in Ukraine.
The database tracks five new LNG export facilities built since 2012, six expanded facilities, two facilities currently under construction, 10 projects permitted but not yet built, and 15 proposed projects with pending permit applications.
All the current and proposed projects could release up to 125 million tons of greenhouse gases per year, according to public records cited in the Oil & Gas Watch database. Using values from the EPA’s greenhouse gas equivalencies calculator – which is built into our database – that much greenhouse gas pollution is comparable to the emissions from more than 30 coal-fired power plants or 25.1 million cars operating for a year.
In January this year, the Biden Administration put a temporary pause on all new gas exports to countries with which the U.S. doesn’t have a free trade agreement. But a Trump-appointed federal judge on July 1 blocked the Biden Administration’s action, allowing the LNG terminals to move ahead.
The database also includes ammonia and fertilizer manufacturers, the vast majority of which make products using natural gas. That industry has also seen a boom in the U.S. due to high global fertilizer prices affected by Russia’s invasion of Ukraine and growing interest in using ammonia as a fuel in ships and for power generation, among other factors. The database tracks 34 proposed new facilities, three under construction, and 17 built or expanded since 2012.
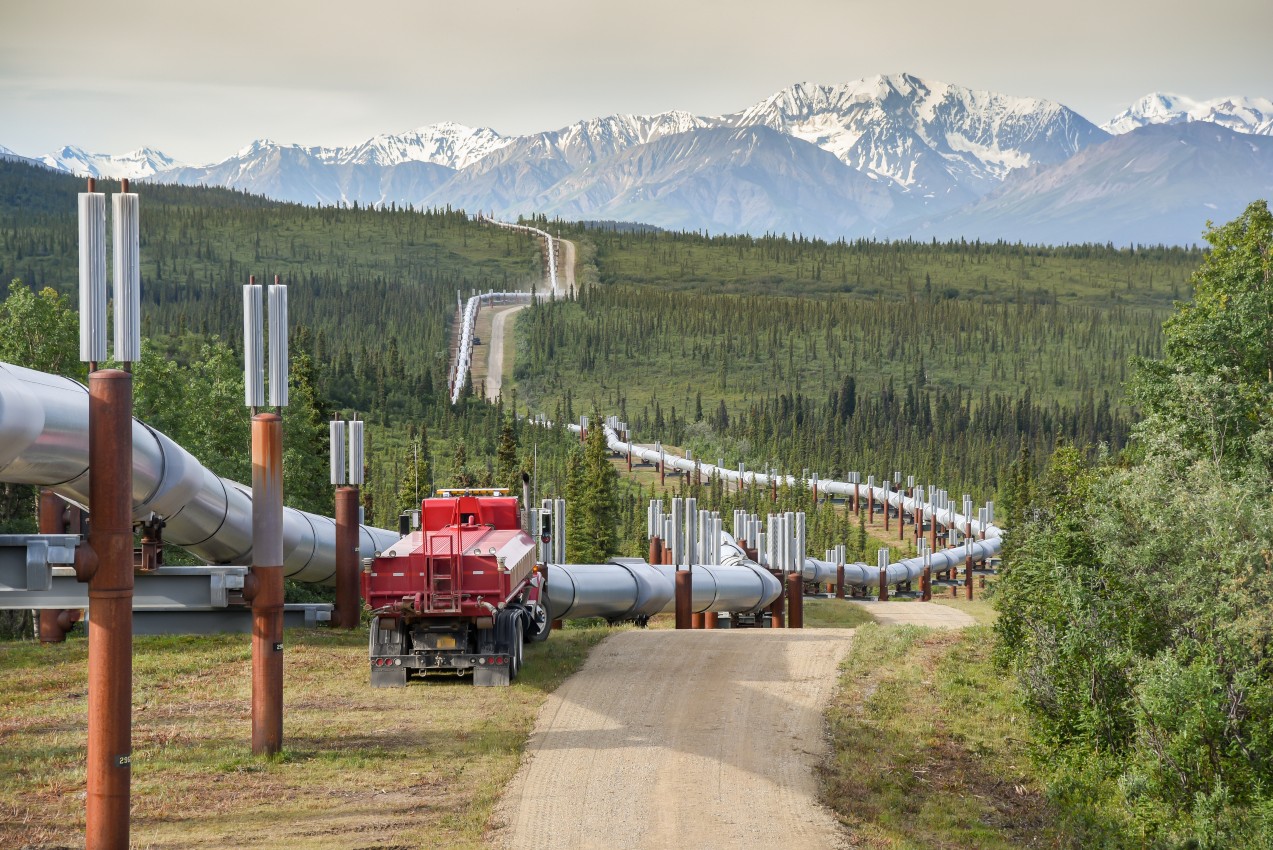
The database also includes information about 291 pipeline projects. These include 38 new pipelines built since 2012 and 83 expansions since then, as well as 78 proposed new pipelines and 68 proposed expansions. Of all these, more than three quarters are natural gas pipelines, with the rest carrying crude oil, carbon dioxide, natural gas liquids, or other products.
Improved maps are also key features of the redesigned website site. Users are now able to see which other facilities and pipelines nearby are connected to a project they are interested in. Many of the pipeline routes are digitized, thanks to a collaboration with Healthy Gulf and FracTracker Alliance, with more digital pipeline routes added on a regular basis.
An increasing share of the database is also devoted to newer energy technologies, such as carbon dioxide sequestration, the production of alternative fuels such as ammonia and hydrogen, chemical recycling, and refineries that produce jet fuel and diesel from wood and agricultural waste.
Also launching this week are EIP’s revamped Oil & Gas Watch News and newsletter, which provide original reporting based in part on data and public records in the Oil & Gas Watch database. Since launching in July 2022, Oil & Gas Watch News has published 97 full-length articles and hundreds of project updates. The redesigned news website includes a “news briefs” section that provides a plain English explanation and additional context to the updates on oil and gas industry projects.
The newsletter currently reaches more than 5,000 people, with a new edition every week. Sign up to receive Oil & Gas Watch Newsletter in your inbox by clicking here.
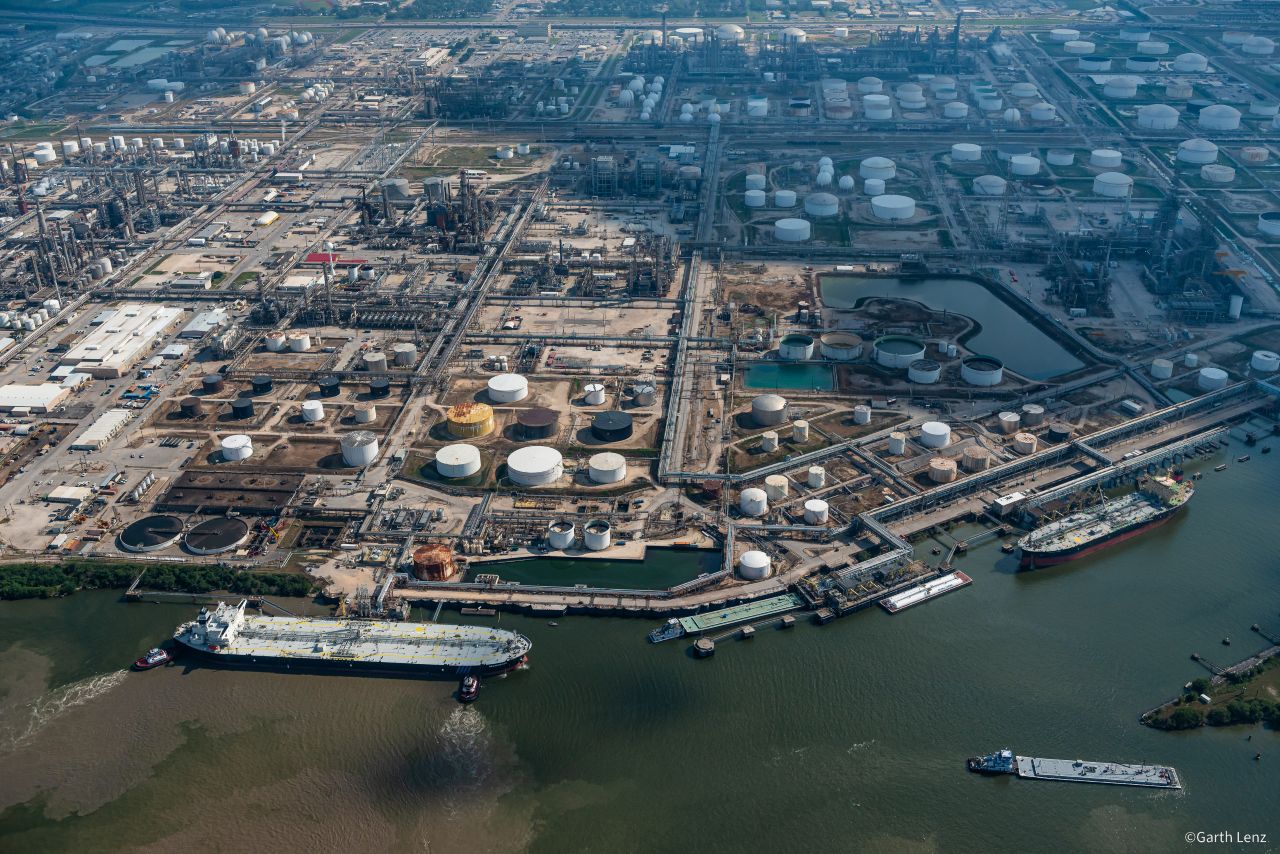
Lead photo: Refineries, chemical plants, and terminals line the Houston Ship Channel in this aerial view from August 2023. Photo by Ted Auch, FracTracker Alliance, 2023.


